
Bali Zoo Merchandise
A task management system for Bali Zoo Merchandise — one place to see what every team is carrying, across every company it produces for.
About the Client
Bali Zoo Merchandise makes merchandise for other people's brands — and runs a different calendar for each one.
The studio designs, samples and produces retail merchandise: seasonal collections, store openings, event runs. The work is not for one brand but for a group of them, each with its own approvers, its own deadlines and its own set of design files. In a single week the same team is carrying a new collection for one company, a store fit-out for another and an event run for a third — the people overlap even though the projects never do.
The Challenge
Coordination lived in group chats, spreadsheets and the weekly meeting. Progress was whatever the last person had reported out loud, so a task that had quietly stopped moving looked exactly like a task being worked on. Nobody could answer who is free next week? without asking around, and nobody could answer where is this collection? without opening four threads. Files for a project were split between WhatsApp, Drive and somebody's laptop, and work for different companies sat in the same undifferentiated pile.
Our Approach
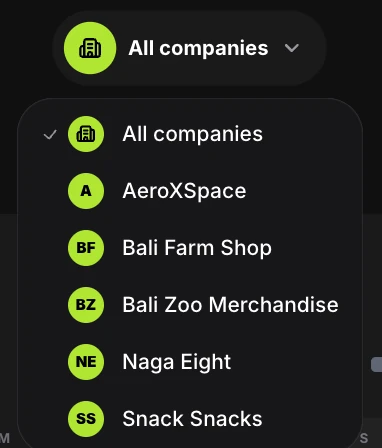
Give every company its own workspace, and put one switcher above them all.
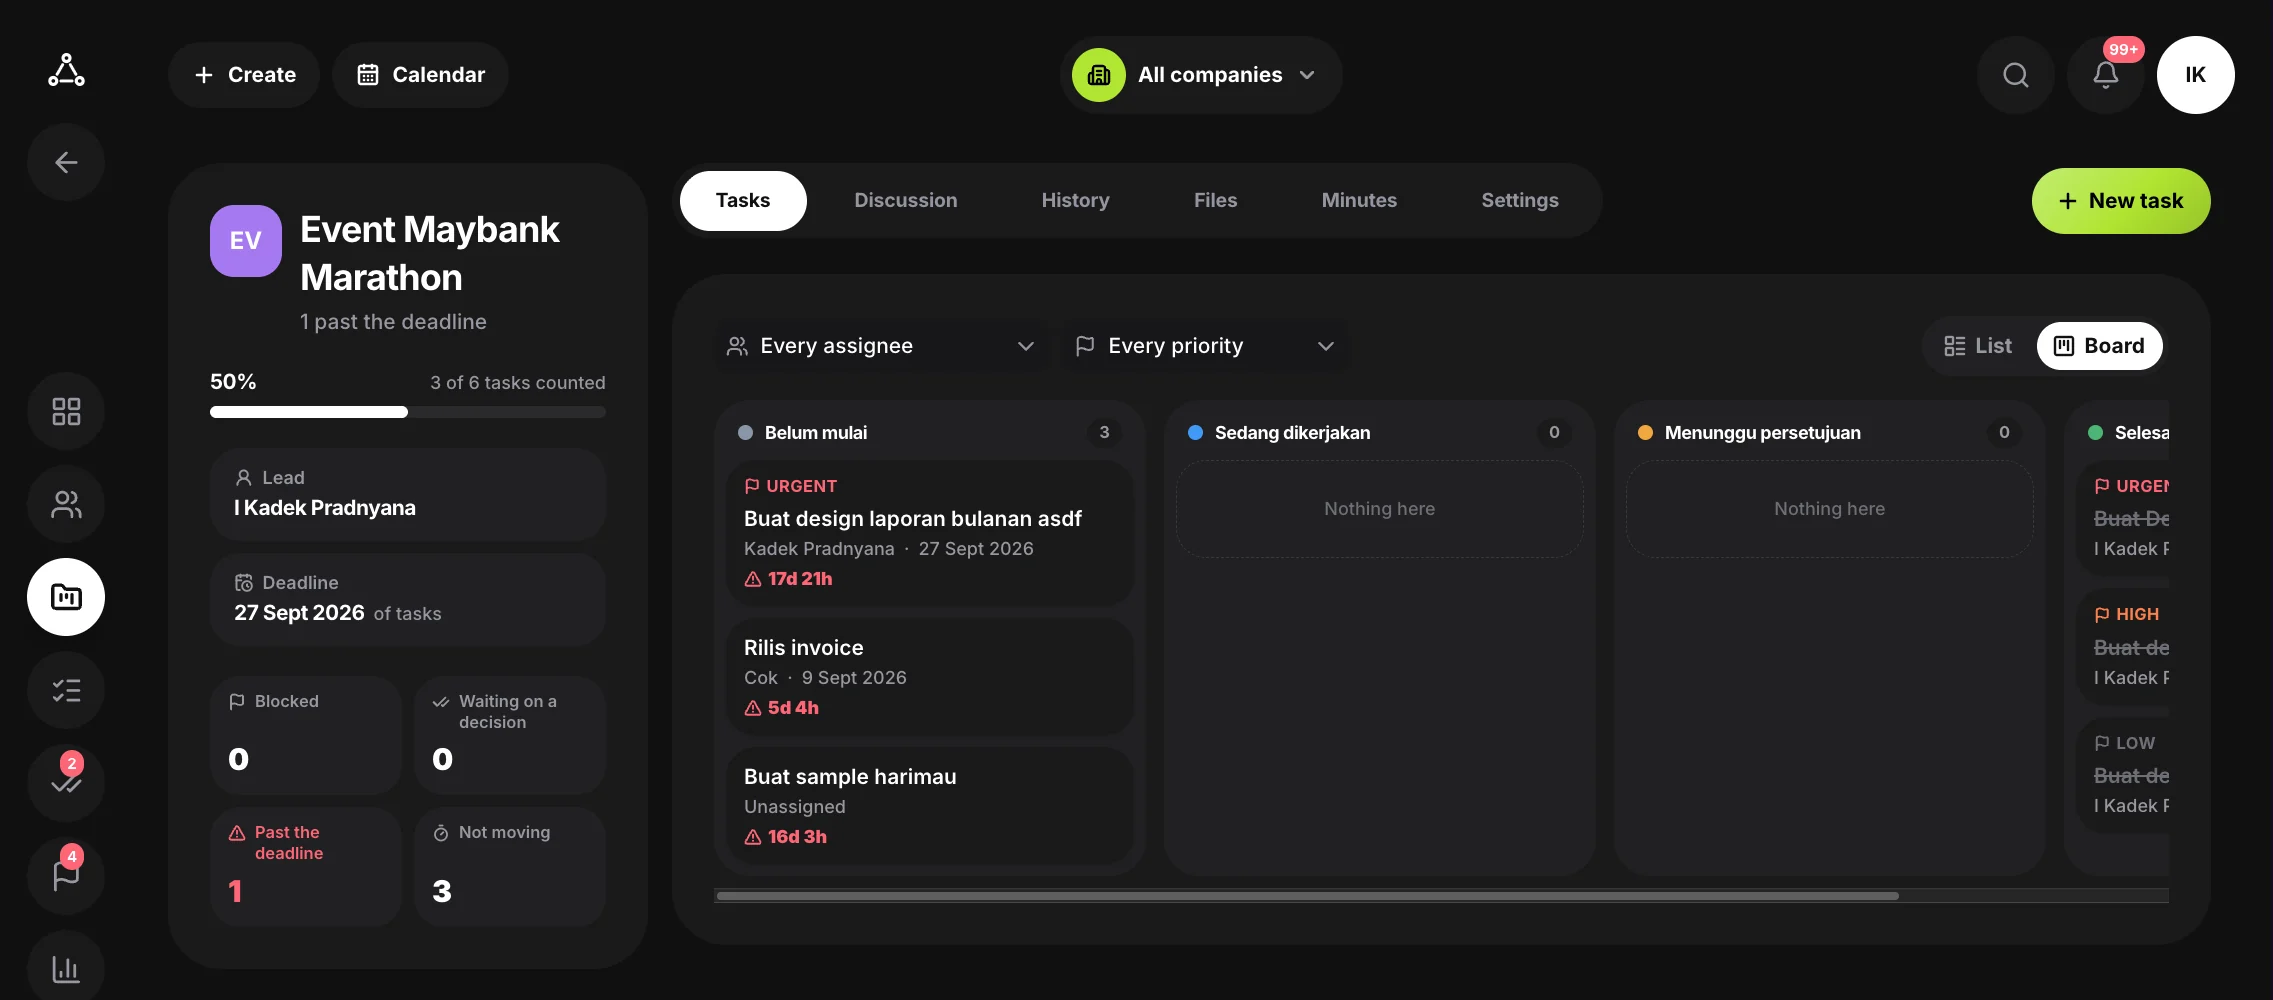
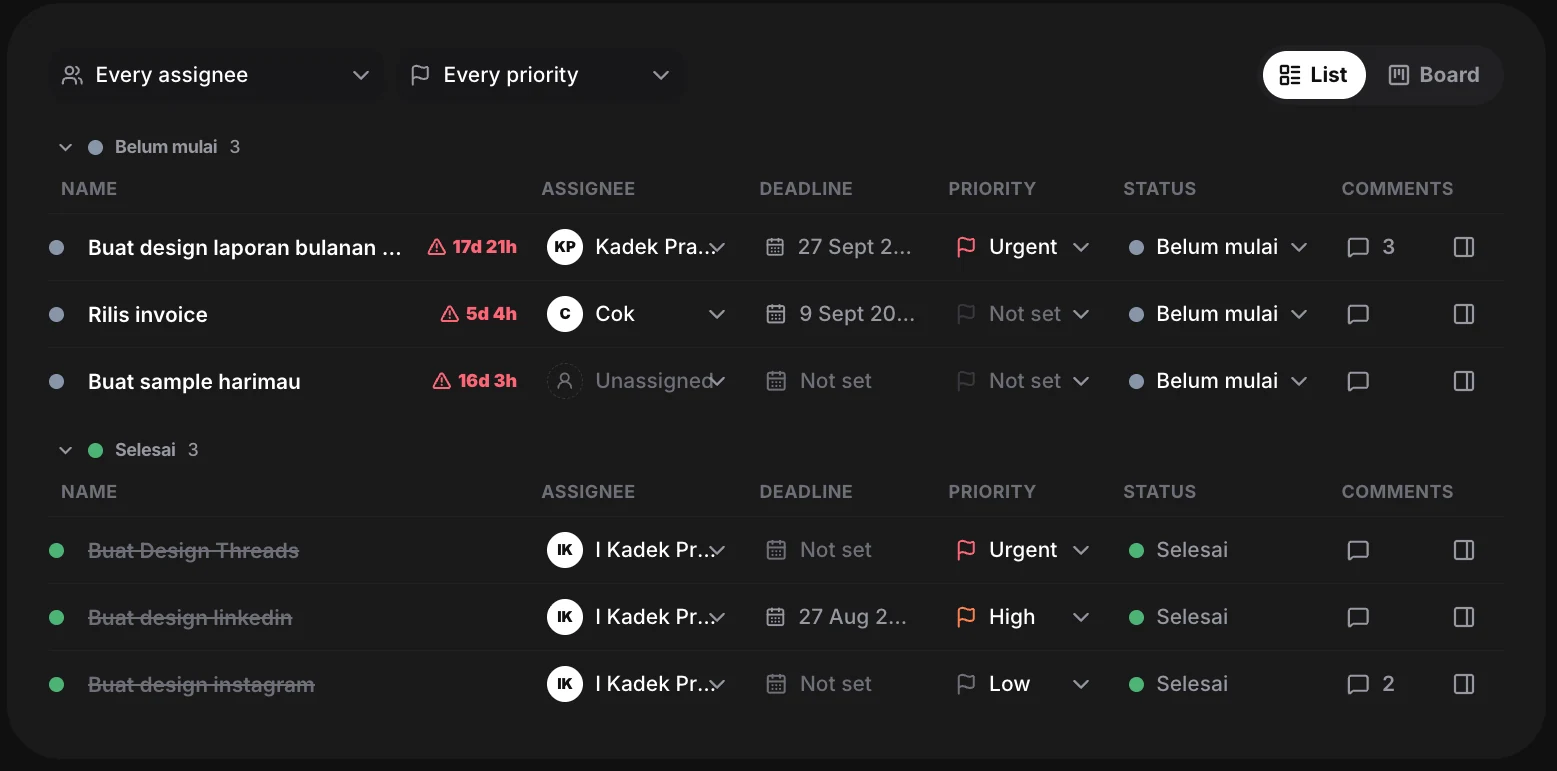
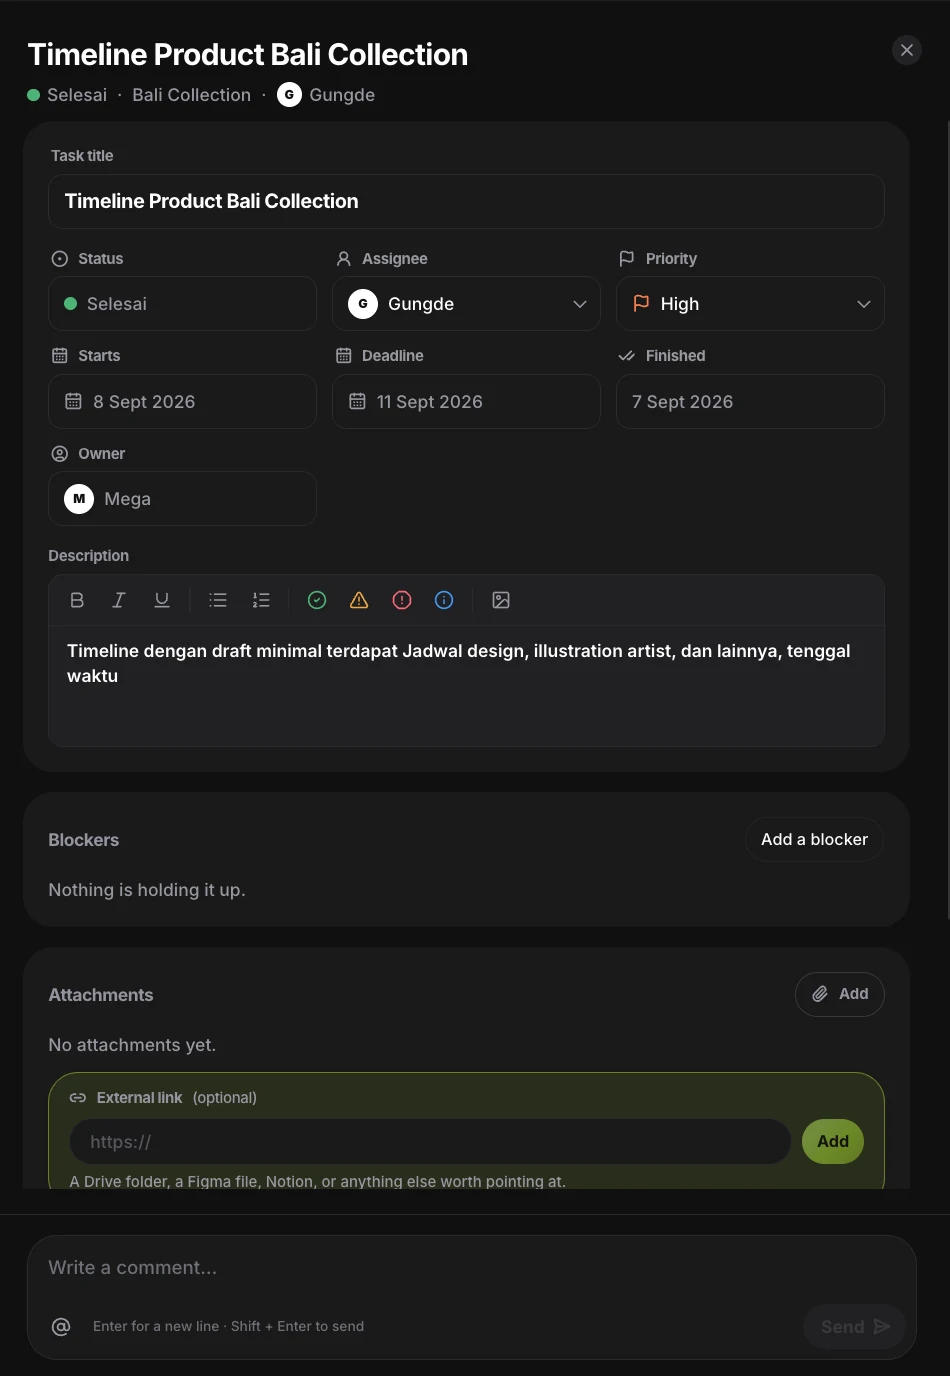
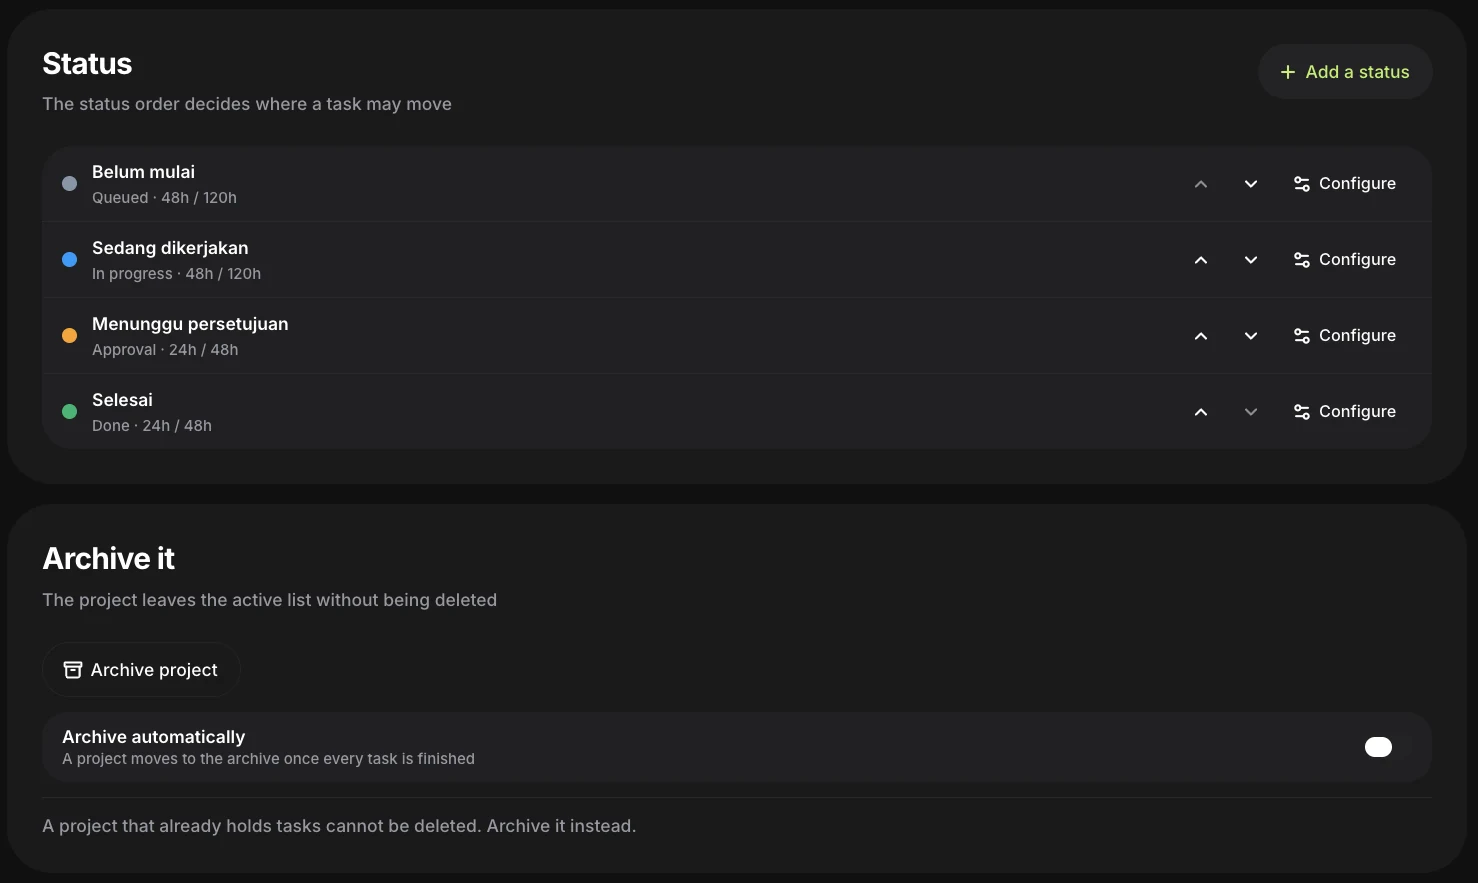
Projects, members and access are scoped per company, so a collection for one brand is never in the way of an event for another — but a manager can flip to “all companies” and see the whole studio at once. Statuses belong to the project rather than to the software: a team names its own steps in the language it works in, and each step carries two ageing thresholds. Past the first, a task is flagged as not moving; past the second it is escalated. Stalling becomes something the board notices instead of something a person has to remember. Each task carries its assignee and owner, priority, start, deadline, estimate, blockers, comments, attachments and external links — the Drive folder or Figma file that the work actually lives in — so the context sits on the task and not in a thread. The same tasks read as a board when the question is what stage the work has reached, and as a list when it is who owns what and when it is due.
The Result
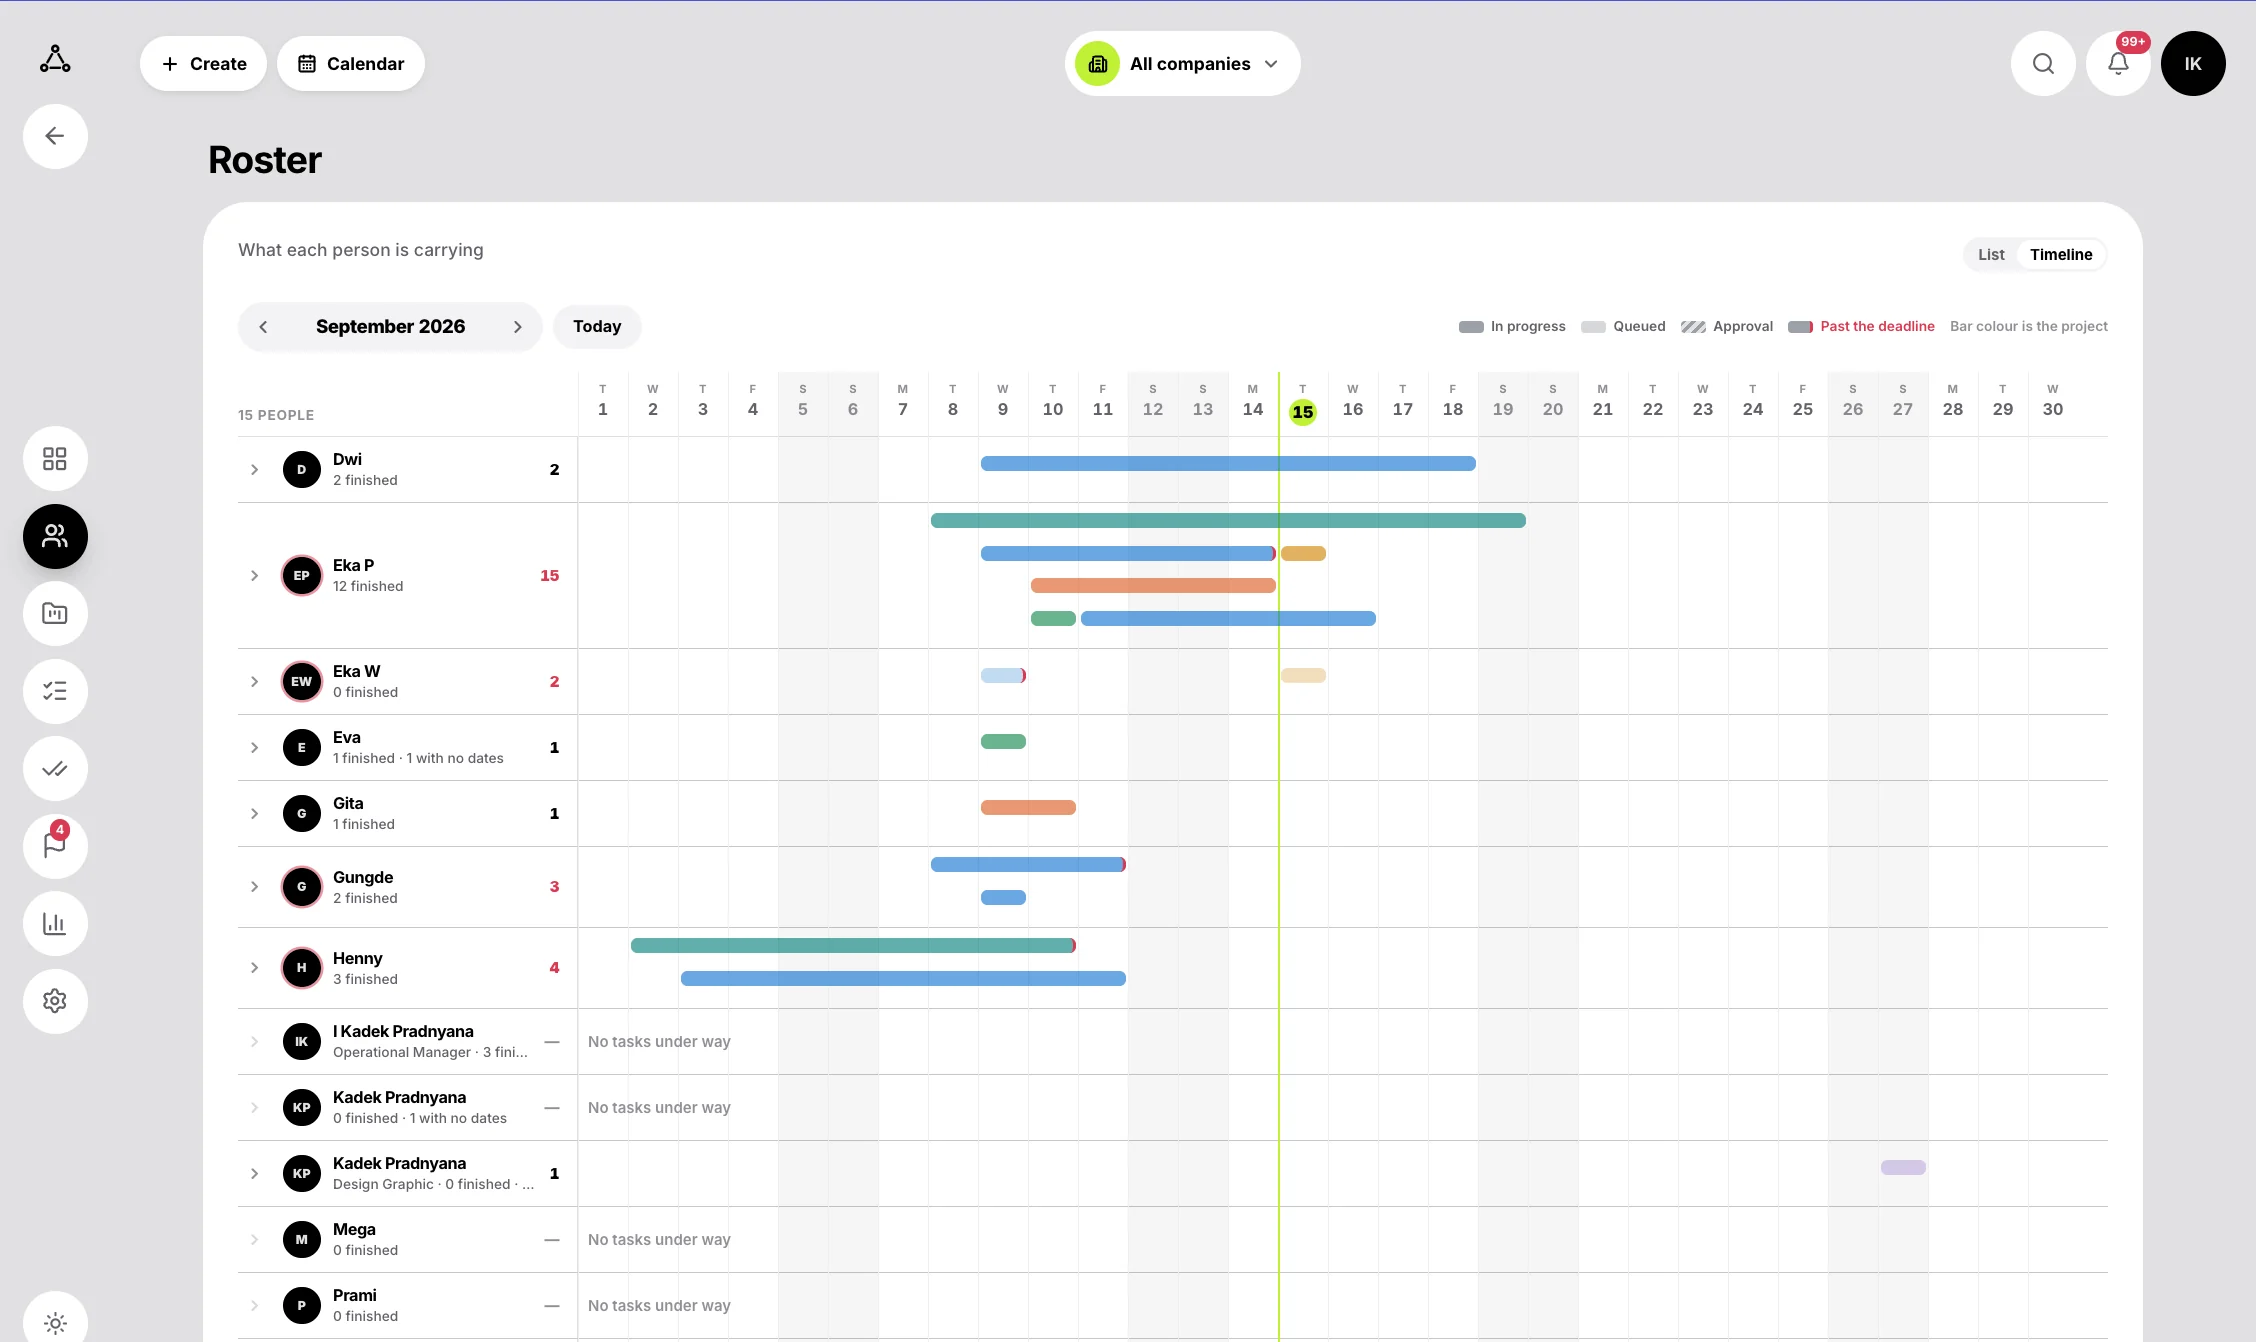
“Who is carrying what” is now one screen.
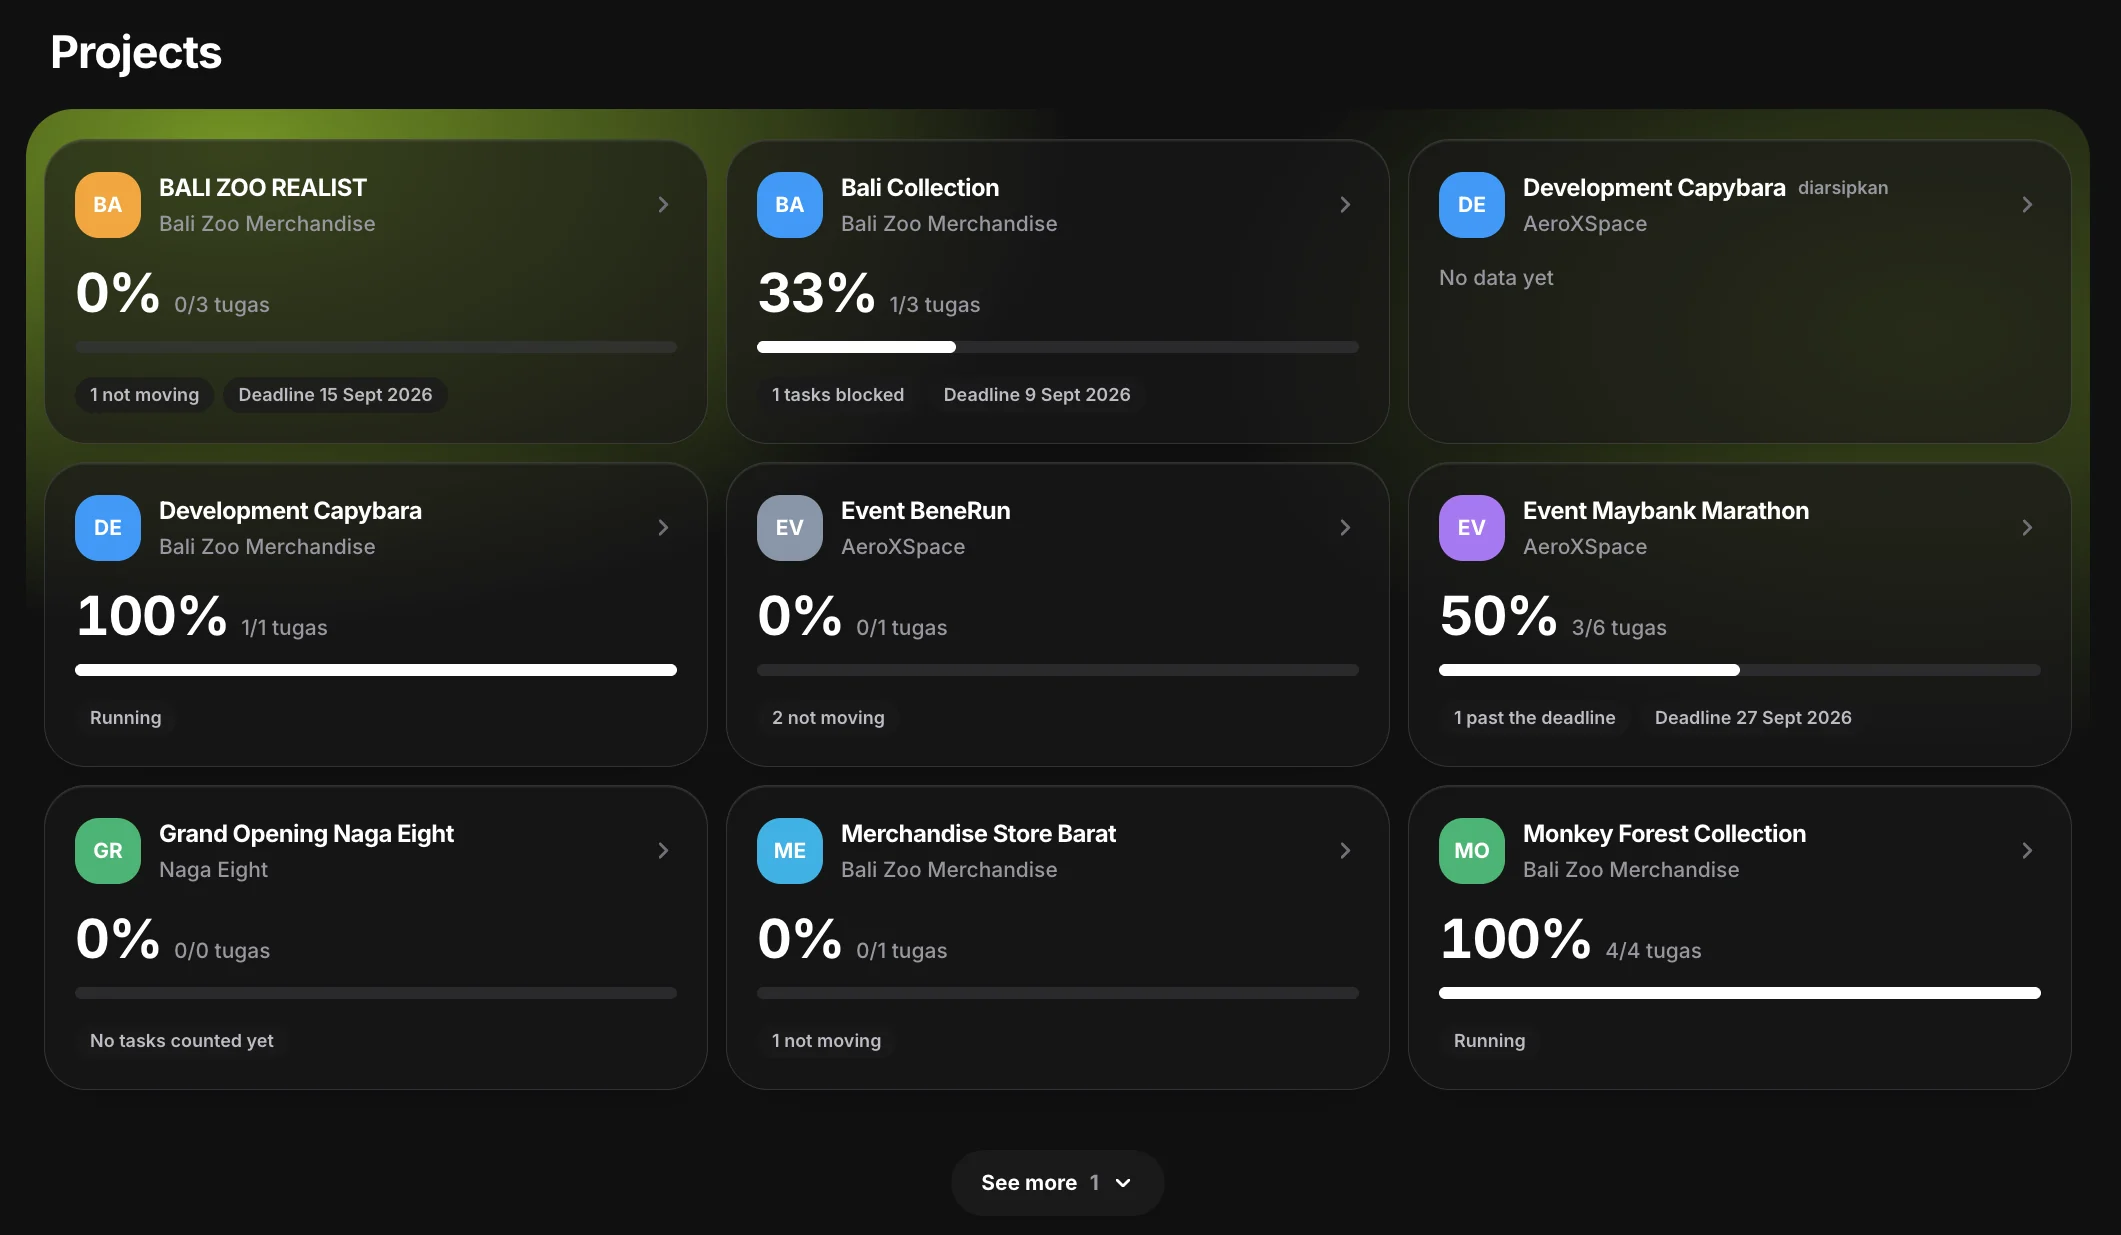
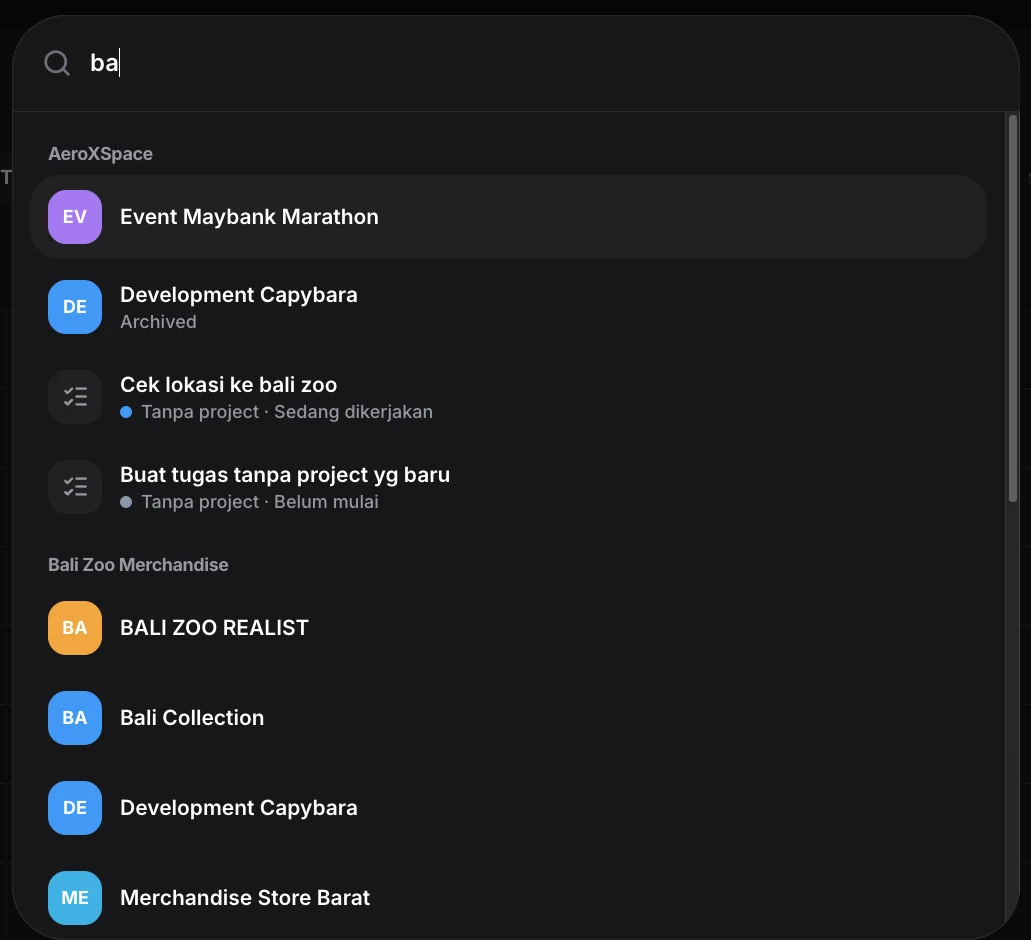
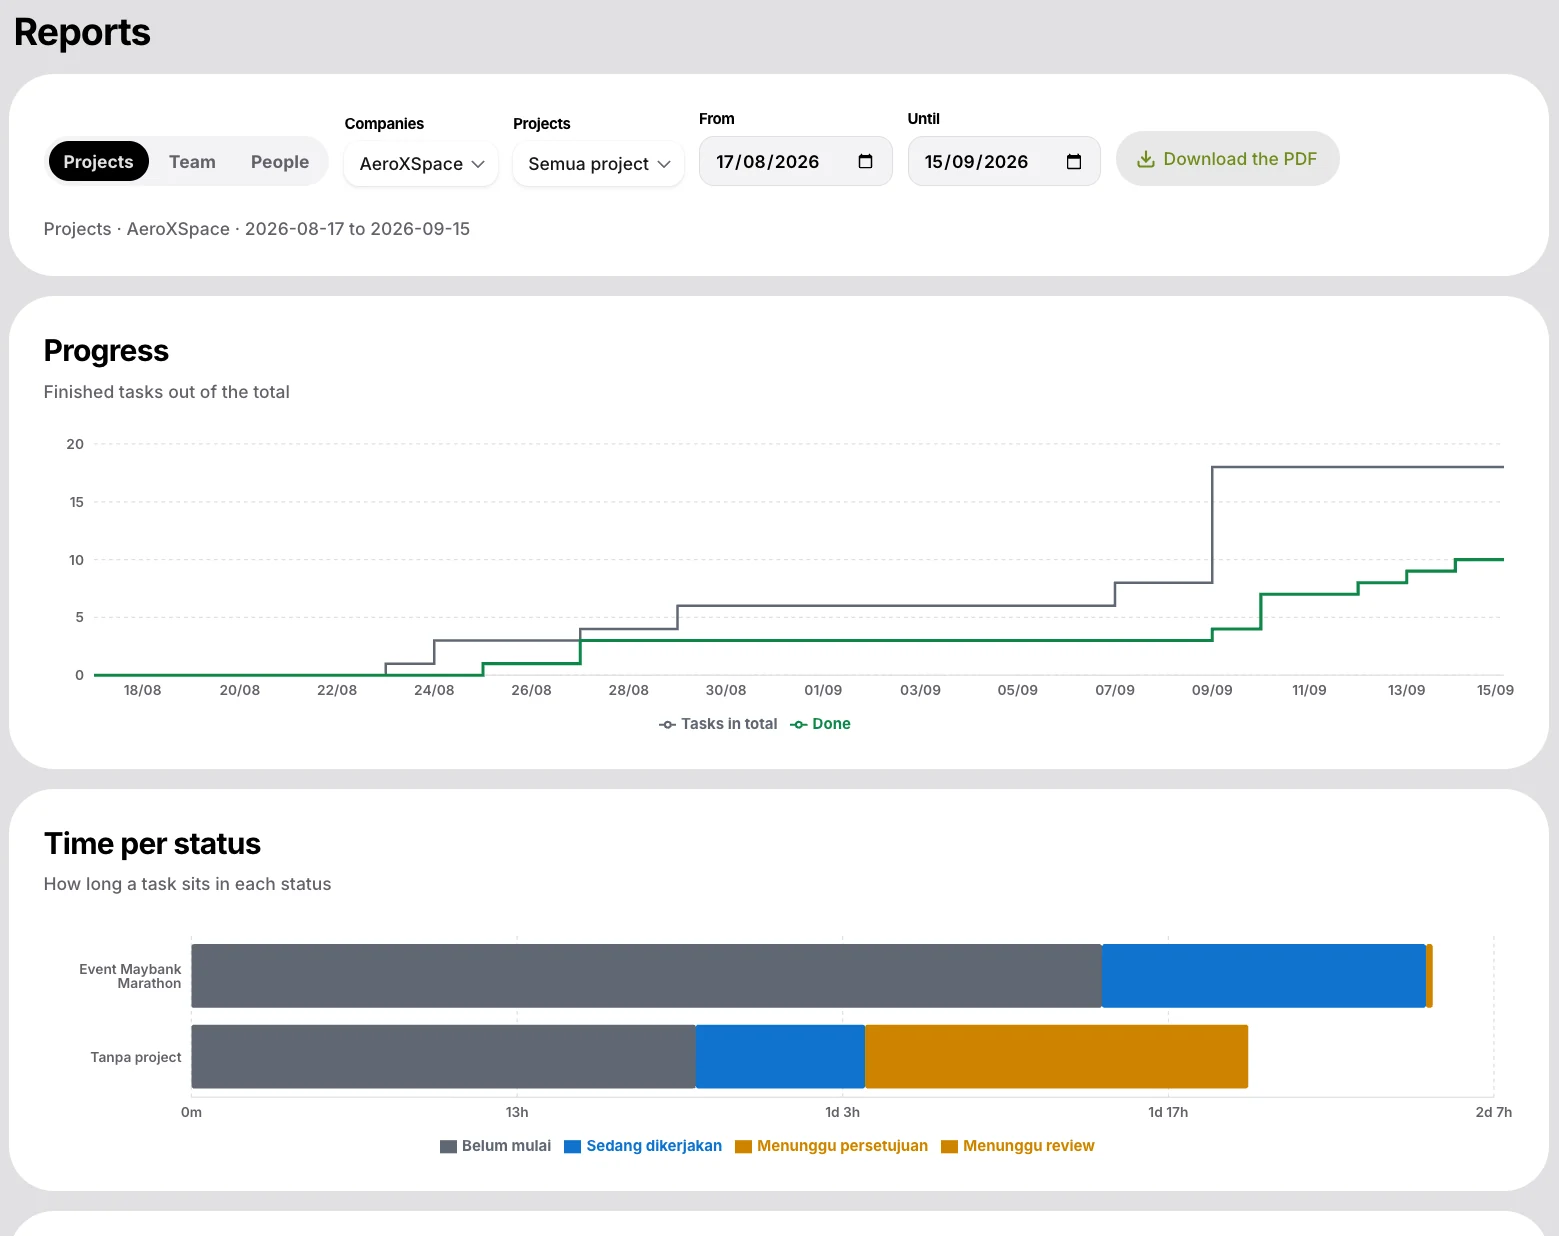
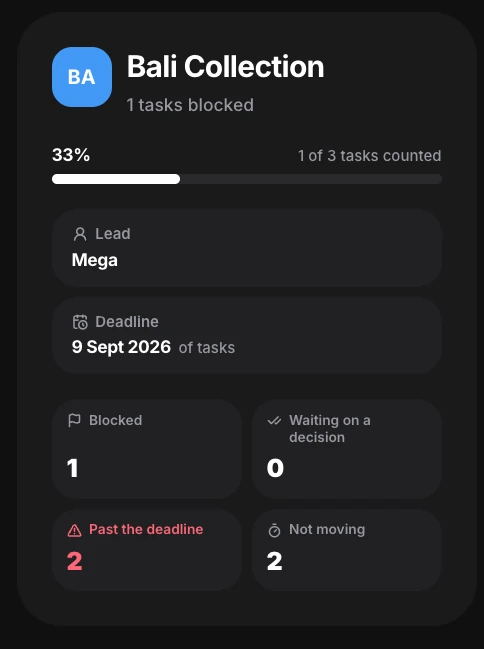
The roster puts the whole team on a month timeline — one bar per task, coloured by project, with overdue work marked in red and idle people stated plainly rather than left blank. Every project card leads with the four numbers the managers chase: blocked, waiting on a decision, past the deadline, not moving. A project's deadline follows its last unfinished task instead of being maintained by hand, and a project archives itself once the last task is done. Reports close the loop over any date range — finished tasks against the total, and how long work actually sits in each status, by company or by project, exportable as a PDF for the weekly meeting. Search reaches across every company at once, discussion and meeting minutes sit on the project they belong to, and the interface follows light, dark or system theme — which matters for a team that is half in a production space and half on a laptop at night.
Running several teams — or several companies — out of one group chat?
We build internal systems around how a business actually works, not around a template. Let's talk about yours.